• Skip to primary navigation
  • Skip to main content
TCarta Satellite-Based Hydrospatial Tech

TCarta Satellite-Based Hydrospatial Tech

We are your contact for Marine Remote Sensing and Hydrospatial data services.

  • Who We Are
    • About
    • Partnerships & Affiliations
  • What We Do
    • What is Hydrospatial?
    • What Do We Measure?
    • How to Work with TCarta
  • Products & Services
    • Products
      • Global Bathymetry GIS
      • Satellite-Derived Bathymetry
      • Seafloor Classification
      • Newsletter Archive
      • Marine Basemaps
    • Services
      • Blue Carbon Mapping
      • Synthetic Aperture Radar (SAR)
      • Satellite-Derived Water Quality
      • Trident Tools Satellite-Derived Bathymetry Software
    • Custom Solutions
  • Case Studies
    • Space-based Hydrospatial Solutions for Engineering Projects in the Littoral Zone
    • Technology Demonstration Project: Large-Scale Satellite Derived Bathymetry Mapping
    • Hydrographic Office Technology Integration
    • Updating Information on Nautical Charts in Baffin Island, Canada
  • News & Press
    • Newsroom
    • Blogs
  • Product Viewer
  • Contact
  • Show Search
Hide Search

lidar

Enhance Bathy Lidar Collection Planning with Space-Based Water Quality Monitoring

TCarta Marine · April 15, 2025 ·

Accurate and timely environmental data is critical for the success of hydrographic surveys. One increasingly valuable tool in this domain is space-based water quality monitoring, which offers powerful support for airborne LiDAR bathymetry programs. By assessing daily and historical water clarity conditions from satellite imagery, this method provides essential guidance for flight planning, acquisition timing, data quality assurance and reporting.

Why Water Quality Matters for LiDAR

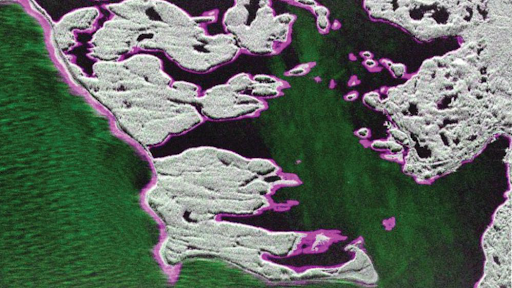
The performance of bathymetric LiDAR systems is highly dependent on water clarity. Turbid or sediment-rich waters scatter and absorb the laser pulses used in LiDAR surveys, reducing their ability to penetrate the water column and reach the seafloor. This makes understanding water quality—especially parameters like turbidity, suspended particulate concentration, and light attenuation—vital for ensuring successful, cost-efficient LiDAR acquisitions.

Existing methods rely on in situ measurements, which are costly and require mobilizing personnel and equipment. As a result, data collection is often limited to a few points. Alternatively, some approaches depend on local knowledge or visual assessments from the air. While these approaches can help determine broad acquisition windows, they often lack spatial and temporal precision which is vital for detailed planning and contextualizing data quality. 

Processed multispectral satellite image from February 2023 showing Turbidity (FNU)

Space-Based Monitoring: A Strategic Advantage

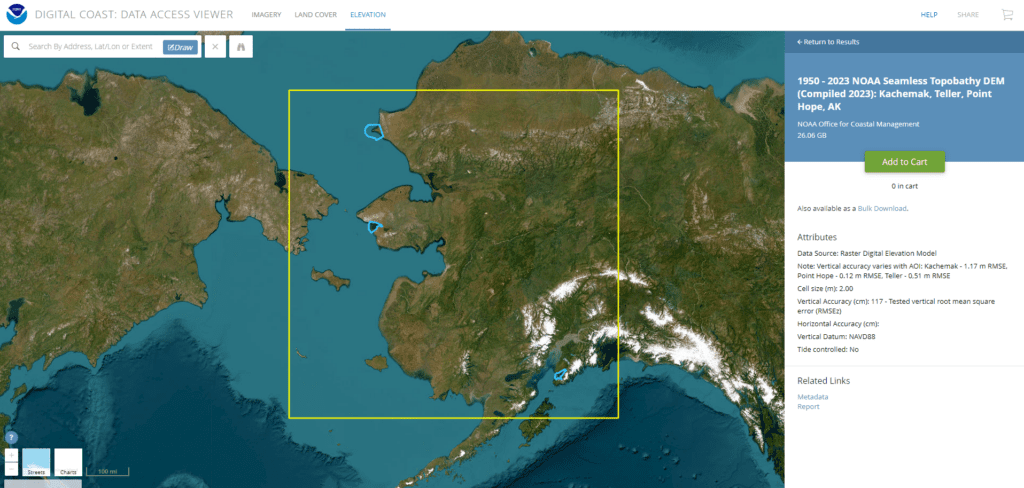
Using high and moderate resolution multispectral satellite imagery from platforms such as Sentinel-2 and PlanetScope, TCarta offers a robust and cost-effective satellite water quality monitoring service. This service enables both historical and near daily evaluation of water conditions across survey sites.

For planning bathymetric lidar flights, satellite-derived data can:

  • Identify optimal collection windows when water clarity is most favorable.
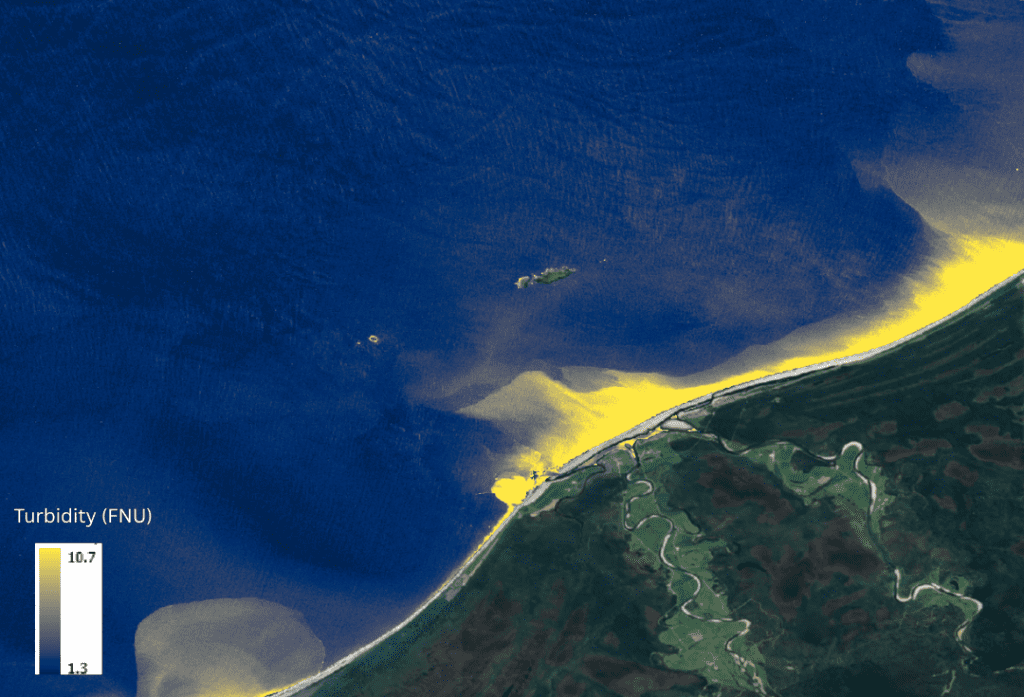
  • Detect turbidity plumes that may limit LiDAR acquisition.
  • Support adaptive flight planning, adjusting flight plans or survey sites to maximize  success based on physics-based analysis.
  • Contextualize data quality after acquisition.

Core Water Quality Metrics

Key parameters analyzed through satellite-based methods include:

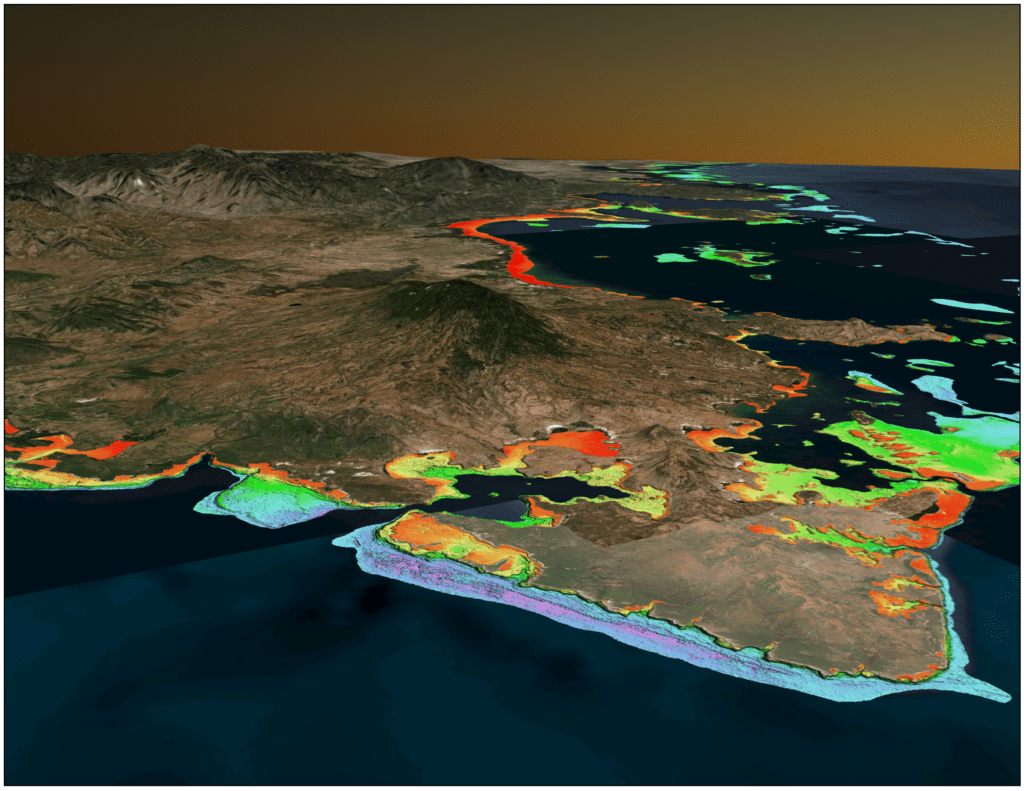
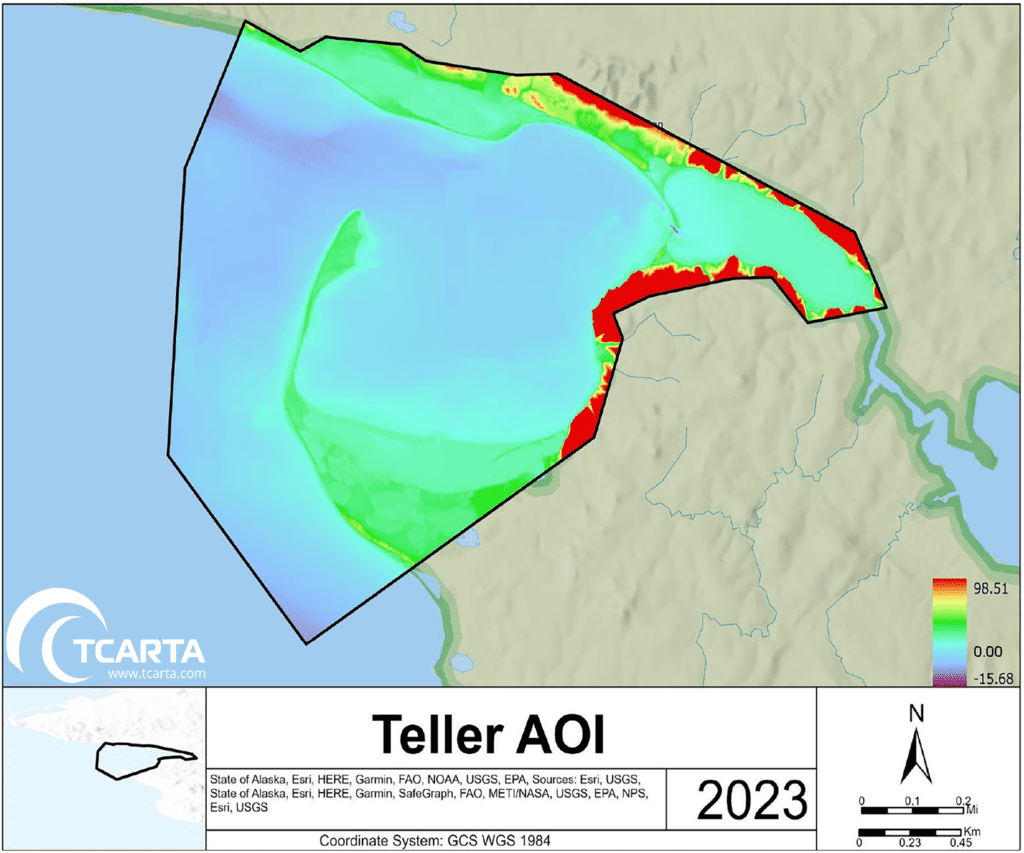
  • Kd490: The diffuse attenuation coefficient at 490nm (blue/green). Quantifies the rate at which blue/green light is absorbed and scattered as it travels through the water column.
  • bb490: The backscattering coefficient at 490nm. Indicates the amount of blue/green light scattered back towards the sensor by particles and other constituents in the water column.
  • bbp533: Particulate backscattering coefficient at 533nm. Indicates the amount of green light scattered back toward the sensor by particles. A good proxy for LiDAR laser penetration.
  • Secchi Depth: An indication of how deep light can penetrate into the water column using a simulated Secchi disk.
  • SPM: An estimate of the amount of suspended particulate matter in the water column.
  • Turbidity: The amount of scattered light proportional to the concentration of particles in the water. Sensitive to particle size, shape, composition, density, and color.
Example of customized Water Quality Dashboard

By combining daily PlanetScope observations with historical Sentinel-2 data, daily monitoring data can be evaluated against historical trends for more accurate anomaly detection. This customizable multi-temporal approach helps surveyors understand both seasonal patterns and real-time shifts in water clarity, supporting strategic mission execution.

Broader Applications: From Planning to Environmental Monitoring

In addition to supporting LiDAR surveys, TCarta’s water quality monitoring is also used across multiple sectors. One key application is the detection and tracking of harmful algal blooms (HABs), which pose risks to ecosystems, public health, and fisheries. Industries such as aquaculture, coastal engineering, and marine construction also benefit from reliable, up-to-date water quality information.
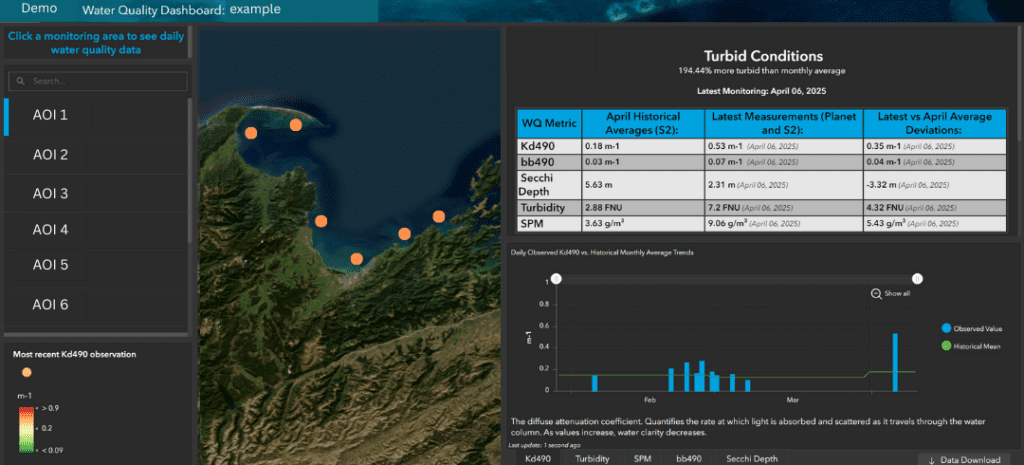
Deliverables

Clients receive access to a customized and dynamic web dashboard along with downloadable reports, graphs, and time series charts. These tools allow users to:

  • Monitor trends over time.
  • Compare current water conditions with historical baselines.
  • Make informed decisions during and after survey operations.
  • Report on water conditions as they relate to collection success.
  • Identify if reflights to infill data gaps will be successful.

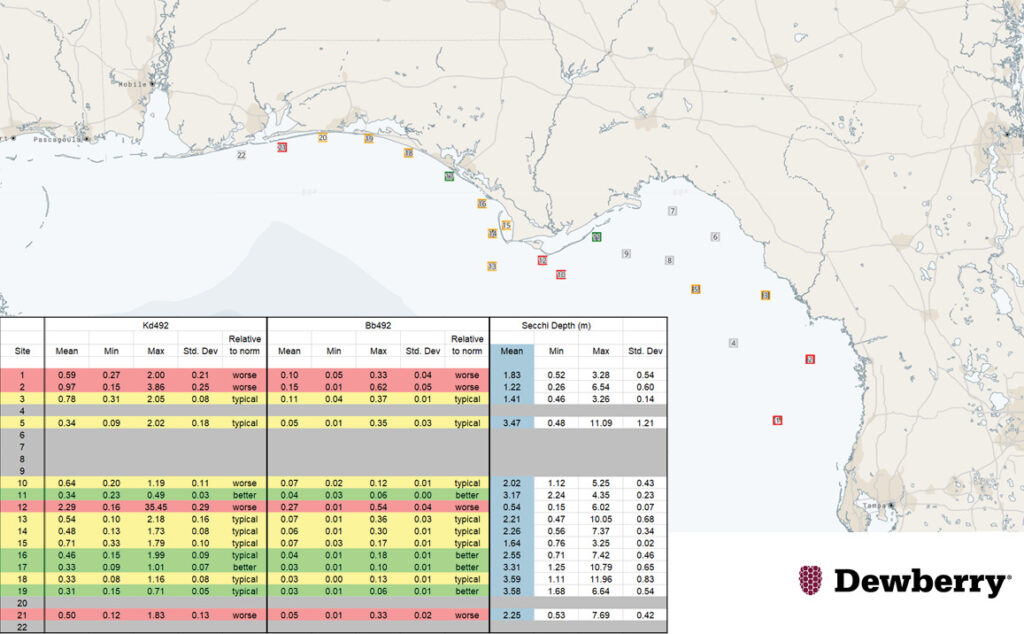
Case Study: Florida Coastal Mapping:

Mapping Florida Waters

A Smarter Approach to Survey Success

Space-based water quality monitoring transforms how bathymetric LiDAR missions are planned and executed. By giving surveyors “eyes in the sky,” it enhances operational efficiency, data quality, and overall mission outcomes.

As a leader in satellite-derived marine data solutions, TCarta offers satellite-based Water Quality Monitoring as a key service for LiDAR survey planning and operational support. This forward-looking approach continues to revolutionize the way we collect, analyze, and act on hydrospatial information.


Please contact us through the form below to scope your project or discuss capabilities

Click or drag a file to this area to upload.

What is one plus four (write the number)?

Loading

Global Satellite-Derived Bathymetry

TCarta Marine · June 12, 2024 ·

New Satellite Sensors Continue to Improve Technique

—Read in Sea Technology—

In less than a decade, satellite-derived bathymetry (SDB) has evolved from a shallow-water mapping technology that could be applied only in clear, calm waters to one that can now be used cost-effectively and reliably in a wide variety of coastal environments around the globe. A 2023 project conducted in the challenging waters of Alaska was one of several that highlighted the arrival of SDB as a commercially viable, globally applicable seafloor mapping technique.

TCarta Marine of Denver, Colorado, successfully completed the Alaska project despite the presence of nearly every environmental condition that traditionally thwarted SDB production. The results were impressive: Seafloor depths were measured down to 26 m in Kachemak Bay and to 3 m in the murky and turbulent Arctic waters of Point Hope. Additionally, the data sets were delivered on time and within budget to the customer, NOAA’s Office of Coastal Management, and the data were made freely available to the public via the NOAA Digital Coast website: https://coast.noaa.gov/dataviewer/#/.

Fully appreciating the significance of this effort requires an understanding of SDB technology. It involves the analytical processing of the red, green, blue and infrared bands in optical multispectral satellite imagery. These spectral signatures captured by space-based sensors result from light energy penetrating the water column and reflecting off the seafloor. Processing these spectral reflectance values with specialized SDB algorithms calculates the depth of the water.

SAR-based intertidal zone mapping achieved with Capella Space satellites synchronized to capture imagery at high- and low-tide periods. Pink area indicates the intertidal zone in Yakutat, Alaska.

Numerous factors, however, can foil the SDB methodology. Darkness and cloud cover entirely prevent image collection by optical satellites, while the presence of sea ice and high levels of sediment or chlorophyll in coastal waters hinders light penetration, thereby eliminating seafloor reflectance and SDB derivation. The polar regions experience excessive cloudiness and six months or more without adequate sunlight for SDB. During summer months, glacial runoff creates highly turbid waters in addition to large-scale phytoplankton growth due to 24 hr. per day of light. Overall, the conditions for SDB in Alaskan waters are among the most challenging in the world. Despite these drawbacks, SDB is a popular mapping technique that has been applied reliably in many parts of the world and is a vital component to comprehensive coastal mapping programs. The primary benefit is that it can be used in shallow coastal zones that are too dangerous for shipborne methods, such as sonar, or too remote for deployment of airborne LiDAR.

Optical satellites, on the other hand, capture imagery globally across political boundaries and without risk to personnel, equipment, or the environment. The reduction in use of carbon-fuel-burning survey platforms is also a considerable benefit of satellite-based survey methods, and carbon costs are now becoming a consideration in international tenders for ocean mapping.

Geographic areas most amenable to SDB have traditionally included the Caribbean, Red Sea, Pacific atolls and the Arabian Gulf. Historically, SDB extraction from multispectral imagery was performed with one of two algorithms: Radiative Transfer or Band Ratio. The first is extremely computer intensive, sometimes taking days to process one image and requires extensive expertise. Band Ratio, on the other hand, is faster but requires calibration data, such as sonar or other direct depth measurement, which often aren’t available in remote or dynamic coastal zones, and high accuracy is limited due to areas of homogeneous seafloor.

The expansion of commercial SDB to parts of the world once thought impossible or impractical for it has resulted from a convergence of critical factors in just the past several years. These include dramatic improvements in satellite remote sensing capabilities, refinements in machine learning technologies to select images and derived water depths, and global availability of a secondary satellite-based bathymetric derivation method: space-based LiDAR.

The simultaneous emergence of these innovations has enhanced the quality and reliability of SDB measurements in places where it has always been applicable and expanded its technical viability to almost all environmental conditions and geographic locations. Just as importantly, the method can now be affordably applied in massive project areas, even if time and budgets are limited.

This is just the start of a paradigm shift in SDB methodology and applicability. There are additional advancements now being researched—mainly in the form of new satellite imaging technology—that will continue to enhance satellite-derived bathymetry.

Mapping the Alaskan Coastline

The success of the Alaska project would likely not have been possible if it weren’t for the research and development conducted under two Small Business Innovation Research (SBIR) grants awarded to TCarta by the National Science Foundation and NOAA between 2018 and 2022 with the goal of modernizing SDB techniques and expanding the pool of usable sensors. The research focused on overhauling the entire SDB workflow, devising tweaks to the algorithms themselves, as well as experimenting with new and better data imagery selection, data cleaning techniques and accuracy assessment.

The NOAA grant sought to specifically improve SDB outcomes in high-latitude areas such as Alaska and the Arctic. TCarta worked on the theory that notoriously turbulent coastal zones in this region experienced some calm days suitable for SDB. But pinpointing such ideal conditions that also coincided with periods of daylight dramatically narrowed the potential acquisition window of optical satellite image collection.

Fortunately, the availability of SDB-suitable imagery has exploded over the past 25 years with the launches of numerous optical imaging constellations. Gone are the days when the U.S. Landsat and French SPOT satellites were the only image sources, with imagery collected once a week at best. Today, there are numerous Earth observation systems in orbit operated by Maxar, Airbus, European Space Agency (ESA), Pixxel, Planet, Satellogic, and several others that provide a plethora of images to select from.

These satellites have been capturing imagery for years and amassing enormous archives of data covering the entire Earth. In many cases, these archives contain deep stacks of numerous images for each spot on the globe, some with hundreds of images to select from. In addition to more frequent acquisitions, some of these sensors capture reflectance data in different segments of the optical and infrared spectra, which enhance SDB by penetrating deeper into the water column, providing additional seafloor information and enabling more robust corrections for atmospheric distortions.

TCarta had been modifying the original SDB derivation algorithms with the addition of these new spectral bands and ratios of multiple bands and then applying machine learning to recognize the best results from the seafloor extraction process. It was a natural step to then apply machine learning to stacks of archived satellite images and find the ones with the clearest, calmest water conditions for SDB processing. From there, the process was refined to use machine learning to isolate and combine the best pixels from multiple overlapping images for derivation of water depths. Searching the archives manually to find images with the right characteristics would be impossible or too time consuming for practical application. Machine learning makes this possible.

For Alaska, TCarta processed high-resolution multispectral imagery from the Maxar and Planet archives to complete the project. These data sets were chosen for their high spatial resolution and frequency of imagery collection, which were required to meet the bathymetric accuracy requested by NOAA’s Office of Coastal Management. TCarta used a custom process to assimilate the radiometric measurements of the two different sensor systems for consistent SDB extraction.

Incorporation of machine learning into the SDB processing workflow has substantially reduced production time. TCarta routinely processes dozens to hundreds of images in the same time it would have taken for one just a few years ago. This has substantially improved the overall economics and viability of SDB as a commercial service.

Madagascar SDB produced and delivered to the Seabed 2030 global mapping initiative. Marine Institute of Memorial University of Newfoundland 2023 summer interns produced this country-wide data set using TCarta’s Trident Tools SDB software.

Adding Satellite LiDAR for Validation

The other major addition to the SDB workflow has been space-based LiDAR, or laser altimeter, data from NASA’s ICESat-2 satellite. Launched with the intent of measuring the thickness of sea ice, glaciers and tree canopies, the satellite also directly measures seafloor depth down to about 30 m under the right conditions. The LiDAR’s green laser emissions penetrate shallow water, reflect off the bottom, and return a signal to the sensor. The data can be processed to determine depth to high levels of accuracy.

The ICESat-2 measurements are made in single-point survey measurements with approximately 1 m between points along the track and with several kilometers between each track, which means the data cannot be used as a standalone bathymetric mapping tool for broad areas, but its value is still considerable.

ICESat-2 has proved to be the ideal validation and calibration data set that extends SDB utility to remote parts of the world where no control points can be collected or are otherwise unavailable from on-site methods. The ICESat-2 data are applied in two aspects of the modernized SDB workflow. The laser measurements are first employed as training data to train the machine learning algorithms to recognize water depths in optical imagery. The ICESat-2 points are also used to validate the accuracy of SDB calculations derived from the Radiative Transfer SDB method, enhancing the confidence in derived water depth values. By combining both methods and information from two satellites using independent methods for water depth derivation, greater confidence in the results is achieved.

Although TCarta uses the NASA data in all SDB projects now, the value of the data set was demonstrated most vividly in another 2023 project where TCarta performed bathymetric mapping of the entire Madagascar coastline. Mapping the coastal zone of the fourth largest island on Earth was noteworthy for several reasons, aside from its sheer size and remoteness. First, the project was supported by the Seabed 2030 program, which was also the recipient of the final products. Second, TCarta completed the SDB mapping in cooperation with students during a summer work term program at the Marine Institute (MI) of Memorial University in St. John’s, Newfoundland, Canada.

Due to a limited budget and grand ambitions to make large contributions to Seabed 2030, free imagery from the 10-m-resolution ESA Sentinel-2 satellite was used. Thousands of satellite images, many stacked over the same areas of interest, were obtained for the entire Madagascar coast. Without machine learning and ICESat-2, the SDB mapping project would have taken 12 months or more just a few years ago, but the student-involved teams completed it in a few weeks, achieving 24-m-deep measurements along the majority of the Madagascar coastline.

The technology and techniques developed under TCarta’s research grants have not only gone on to benefit the commercial and government projects, but also it has proven to be a tremendous instructional tool for future hydrographers and contributed significant data coverage to the global effort to map the entirety of the seafloor.

Seabed 2030 and Marine Institute of Memorial University of Newfoundland 2023 summer interns and facilitators. Plans for a 2024 (year two) intern program and data contribution to Seabed 2030 are underway.

The Future of SDB

The revolution in commercial imaging satellites has included two types of data collection systems that hold significant potential for SDB applications and supplemental coastal products. These are synthetic aperture radar (SAR) and hyperspectral satellite constellations. The primary advantage to SAR is that, unlike passive optical systems that capture reflected sunlight, radar sensors actively emit signals that can pass through darkness and clouds to bounce off the Earth’s surface and return data. This means they can collect data 24/7 anywhere on the globe. The key difference in recent SAR missions is their spatial resolution supports practical coastal mapping. Commercial SAR operators include Capella Space and Umbra in the U.S., ICEYE of Finland, and Synspective of Japan.

While SAR does not provide seafloor depth information due to lack of water column penetration, it does add important shoreline location data that can enhance SDB accuracy. TCarta has used the radar data collected at both day and night in some high-latitude projects to precisely map high- and low-tide water levels to determine the extent and characterization of the intertidal area. These shoreline features can be applied as a complement to the SDB products, but it is often requested by some commercial clients as a standalone coastal map product.

TCarta has teamed with Capella on joint research projects to determine other ways high-resolution SAR can be incorporated into marine mapping and possibly SDB projects. As an analytic partner, TCarta has been developing coastal products and tools for ready use by customers around the globe. The potential for hyperspectral satellite data to directly impact SDB by facilitating deeper and more accurate seafloor measurements is even more significant. Generally referring to sensors that acquire reflected data in more than 10 spectral bands, hyperspectral systems have recently been launched by several companies: Pixxel in India, Wyvern in Canada, Orbital Sidekick of the U.S. and others.

The excitement for SDB analysis is that these sensors capture reflected energy in very narrow bands across the visible and infrared portion of the spectrum. Initial research by TCarta in cooperation with Pixxel indicates these narrow bands, especially in visible green and blue, will detect reflected energy that has passed more cleanly through the atmosphere without distortion and penetrate deeper into the water column. This will potentially extend the useful range of SDB into deeper, and possibly less clear, water.

TCarta produced SDB in Teller, Alaska, which was integrated with multiple freely available data sources into a seamless topobathy digital elevation model.

While more advanced satellite imaging platforms will continue to play key roles in SDB progress, the SBIR grants from the U.S. government have most directly impacted shallow-water mapping capabilities for the hydrographic and hydrospatial communities. These investments are paying off in terms of safer coastal navigation, more responsible shoreline development, and more diligent environmental protection in the littoral zone.


Kyle Goodrich is the president and founder of TCarta Marine and has a 22-year career in geospatial services. Since founding TCarta in 2008, Kyle has led numerous geospatial product research and development plans, including the development and commercialization of satellite-derived bathymetry, stereo photogrammetric bathymetry, a global aggregation and assimilation of multi-source bathymetry data and global vector shoreline. As principal investigator in TCarta’s National Science Foundation and NOAA Small Business Innovation Research Phase Two projects and as an active industry member in international hydrographic commissions, Goodrich is a persistent and passionate leader in the commercialization of satellite-based marine remote sensing technologies.


You can also view this article on TCarta’s LinkedIn: https://www.linkedin.com/pulse/global-satellite-derived-bathymetry-tcarta-marine-ufmvc/?trackingId=ClUjZSlmjUmSmhTxUKXY3A%3D%3D

Back to newsroom

Satellite Derived Water Quality Analysis

TCarta Marine · February 16, 2024 ·

By Graeme Timmeney

Water quality has a significant history of monitoring across various satellite systems. Since the advent of publicly available satellites with the launch of Landsat in 1972, researchers and scientists have developed various methods for the monitoring of water bodies across the globe. One such satellite, MODIS (Moderate Resolution Imaging Spectroradiometer), an instrument mounted on NASA’s Terra and AQUA Satellite has been utilized in numerous studies related to water quality since its launch in 1999. Researchers have employed MODIS data to offer daily monitoring of water quality parameters such as chlorophyll-a concentration, turbidity, and suspended sediment concentration. The information on water quality derived from these satellites have been used to monitor harmful algal blooms and other water quality incidents throughout the globe. This information offers a historical snapshot in time of water quality at a very low resolution across very large areas.

For many commercial and scientific applications, water quality must be monitored daily, with a short lag time of image acquisition to water quality metrics. One such application, airborne bathymetric lidar, can be heavily impacted by water column conditions such as turbidity and algal blooms. Bathymetric lidar surveys utilize airborne mounted sensors with a green laser at 532 nanometers that can penetrate the water column and return to the sensor, creating an accurate picture of the seabed up to 30 meters deep. Poor conditions can greatly impact the cost of mapping large areas. 

Historical water quality analysis utilizing free satellite imagery can offer a historical snapshot of water quality across large areas with high levels of accuracy, assisting companies with the process of planning for bathymetric lidar surveys. These historical analyses, undoubtedly useful for planning, can only offer previous trends from years past. With the advent of anthropogenic induced climate change across the ocean, seen clearly in the upward trend of sea surface temperature, these historical studies only reflect the past, not the present

TCarta has found and implemented a solution that takes both historical analyses, daily imaging and cloud computing to implement a fast and effective water quality monitoring solution that utilizes Planet Labs daily imaging to assist in bathymetric lidar surveys. Historical surveys at a large spatial scale across an AOI are conducted to identify areas with frequent water quality problems that could affect a bathymetric lidar survey. These large scale historical analyses offer a comprehensive analysis, allowing for the selection of individual sites within the survey area that are most useful for more frequent and current monitoring. With potential sites selected, daily imagery is captured and analyzed for a number of relevant metrics within a matter of hours and posted directly to a water quality dashboard that clients can utilize to assess trends and current conditions at a site on the same day as image capture. This information allows for strategic flight planning based on both the success of previous flights in relation to water quality metrics as well as the current state of water quality over a given study area. This method is agile and effective at reducing the number of flights and overall project cost.

In a partnership with Dewberry, TCarta has implemented its daily water quality monitoring capabilities to assist in aerial bathymetric lidar planning across approximately 25,000 km2 of Florida’s coastline. A web-based dashboard was created to allow Dewberry to visualize water quality at 28 different sites for both historical and daily monitoring. This dashboard is updated within an hour of image capture with both the RGB imagery from Planet as well as 6 derived water quality metrics analyzing the potential for surface and sub-surface water quality conditions. Metrics analyze the potential for water column penetration as well as the presence of surface algae in the water. This dashboard has allowed Dewberry to increase the efficiency of flights across a massive area by informing the project managers of when and where is the best opportunity to fly on a given day. You can read more about Dewberry’s use of the dashboard here: Mapping Florida Waters

DEWBERRY ARTICLE

“Planning aerial acquisition missions, and particularly topo bathymetric missions in Florida, presents unique challenges. With the flat inland and coastal topography, even low-yield, inland rain events can result in large amounts of particulate runoff into the Gulf of Mexico. Combining the runoff with tannic components, such as those in the Suwannee River system in Big Bend, can result in poor water quality and unfavorable conditions for lidar bathymetry.

Figure 8: A daily water condition report for 16 October 2023 for 22 locations distributed in the Big Bend and Panhandle Regions, showing three (Kd492, Bb592, and Secchi Depth) metrics. Gray sample locations were clouded over on the date indicated and no data was generated; pink were below normal expected values; yellow, within normal expected values; green, better than normal expected values.

To help avoid collecting lidar during sub-optimum water clarity conditions, Dewberry has partnered with TCarta to provide satellite-derived bathymetry (SDB) for 22 selected sites dispersed throughout the regions. TCarta delivers the water clarity estimates daily based on several metrics, including the diffusion coefficient (Kd492), the backscatter coefficient (Bb492), and secchi disk depth (Figure 8) to help evaluate the water clarity and interpret current water conditions relative to historic norms. This methodology has helped Dewberry minimize non-productive flights, therefore increasing efficiency and decreasing environmental carbon dioxide loading.”

Back to blogs

Subscribe to our newsletter


Loading

TCarta Marine LLC

1015 Federal Boulevard
Denver, CO 80204, USA

+1 (303) 284-6144

TCarta Caribe LLC

26 Haining Road
New Kingston, Jamaica

+1 (876) 817-8567

TCarta Canada Services Ltd.

1771 Robson Street - 1508
Vancouver, BC, V6G 3B7 CA

  • What We Do
  • Legal
  • Contact
  • LinkedIn
  • Instagram
  • Facebook
  • Twitter