By Natalie Treadwell
In recent years, the field of bathymetric surveying has seen significant advancements, specifically with Satellite Derived Bathymetry (SDB), which has been used to map several regions of the world’s littoral areas. However, in Alaska, the process of SDB validation has been made quite challenging due to a lack of comprehensive support for Alaska-specific datums and geodetic transformations. Updates to the NOAA software VDatum that include Alaska are set to be published around 2026, however in the meantime, researchers at TCarta have been working on novel workarounds to map these coastal regions that are highly susceptible to change due to climate change and erosion. Through a NOAA Office of Coastal Management contract and with Axim Geospatial as Prime Contractor, TCarta completed a pilot project to create a seamless topobathy digital elevation model (DEM) at 2m resolution in Alaska. This pilot project set out to demonstrate how SDB can be used to fill in data gaps in hard to map areas due to accessibility, prohibitive costs and narrow windows of opportunities to perform survey work.

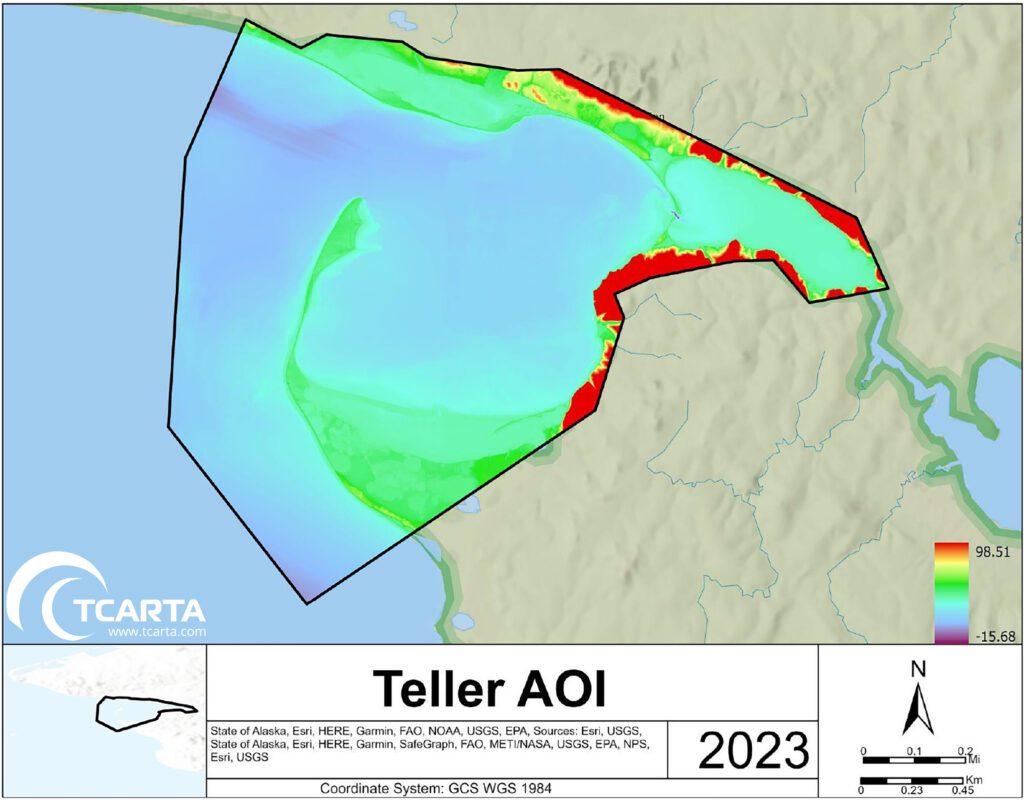
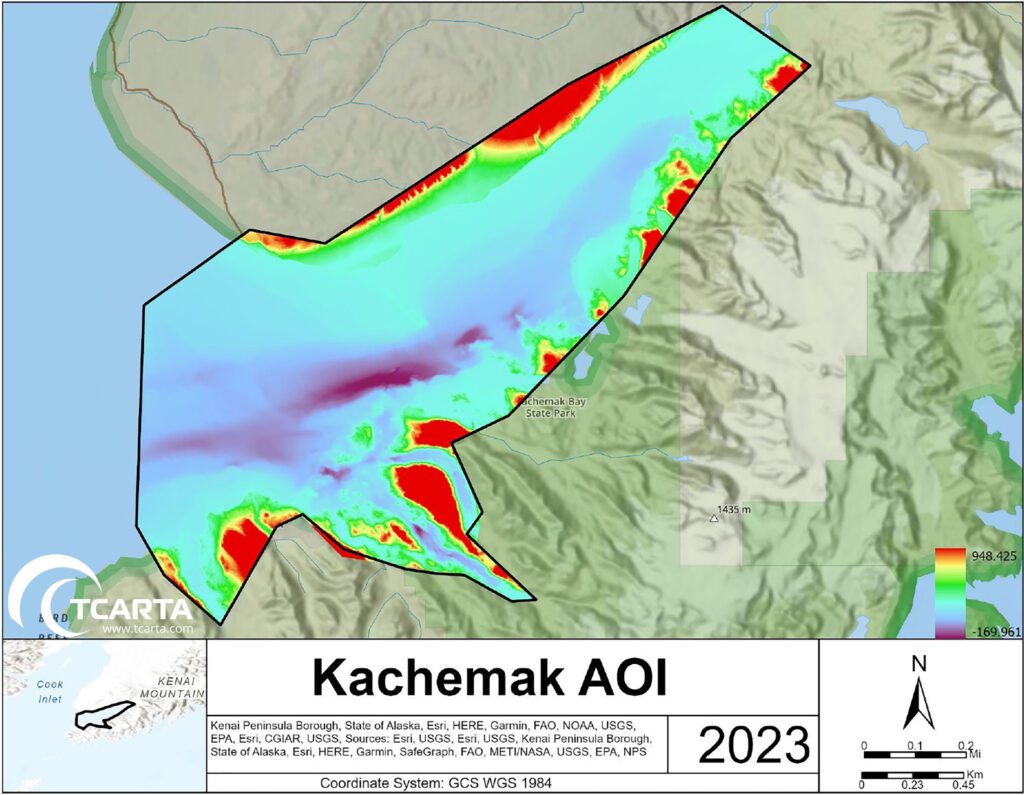
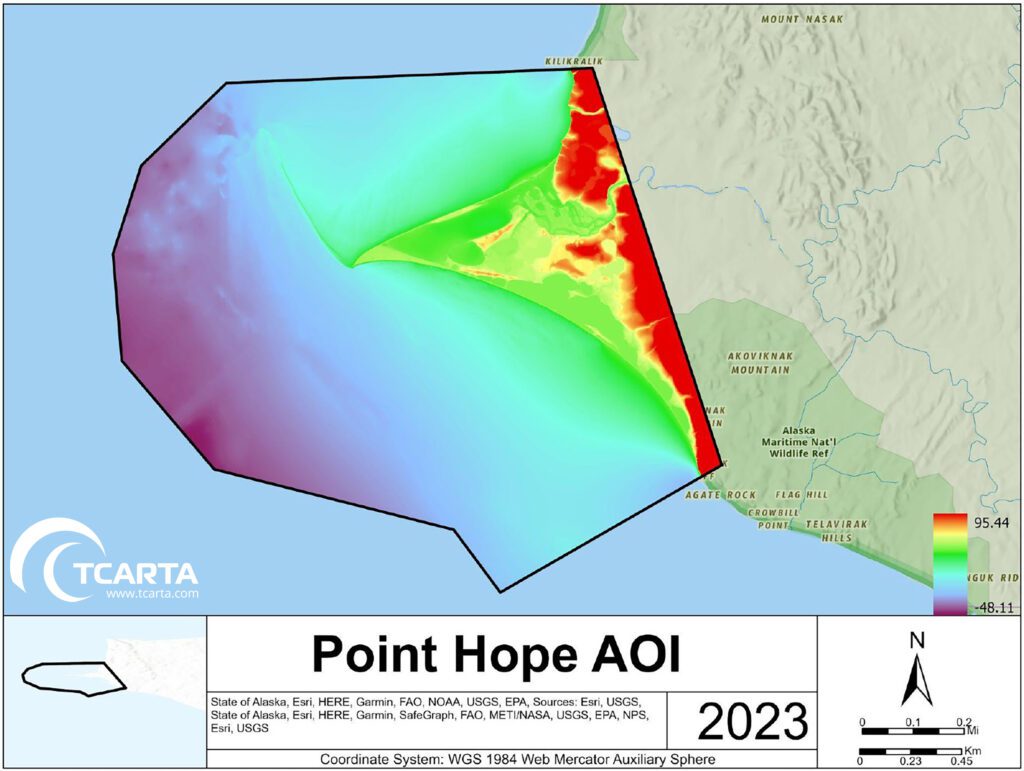
The survey encompassed three extensive areas within Alaska: Kachemak Bay, located in the southwestern part of the Kenai Peninsula, covering 971 km², characterized by extensive tidal flats, braided drainage, and marshland; Teller, situated northwest of Nome on the Seward Peninsula, spanning an area of 1165 km² and a mix of shallow areas, sedimentary deposits, and rugged, uneven terrain due to geological shifts and formation; and Point Hope, situated on the Lisburne Peninsula, encompassing approximately 2,329 km² and the shallow sandy shelf gradually deepening into the Arctic Ocean basin, experiencing erosion due to strong currents resulting in large shifts in coastal bathymetry. Utilizing a combination of newly-produced satellite-derived bathymetry (SDB) and freely available sources including satellite, topobathymetric, and terrestrial LiDAR, single and multi-beam sonar, iFSAR, and interpolation, TCarta generated highly accurate digital elevation models (DEMs) of underwater and subsurface terrain.

The SDB was created using Maxar’s Worldview and GeoEye imagery, and Planet imagery, selected based on visual inspection of environmental conditions to avoid attributes such as water turbidity, glint and solar glare, and cloud cover or shadows. TCarta used internal atmospheric and glint correction tools to enhance images in areas where environmental conditions could not be avoided. It’s Alaska after all, and the sunny days free from glacial melt turbidity can be few and far between. Two primary algorithms were employed to generate the SDB surfaces:
- Random Forest (RF): A supervised machine learning method that incorporates spectral bands from satellite sensors and bathymetry data for depth estimation.
- Radiative Transfer Method (RTM): Utilizes a radiative transfer model to relate remote sensing reflectance (Rrs) to inherent optical properties of water, bottom reflectance, and water depth.
The choice of algorithm depended on in-situ data availability and quality. For instance, the RF method was predominantly used, while the RTM method was only employed in areas lacking bathymetry data intersections.
The vertical datum for this project was the North American Vertical Datum of 1988 (NAVD 88) (meters) referenced to GEOID12. The chart to ellipsoid datum transformation was done using an internally developed ellipsoidally referenced tidal datum model (ERTDM) based on Riley et al., 2016, as a replacement for VDatum for Alaska. The ERTDM was utilized to perform the VDatum transformation from MLLW to NAVD88 (GEOID12). A MLLW – NAVD88 (GEOID 12) triangulated mesh covering all the Alaskan tidal benchmarks, provided by the Coast Guard Survey Development Lab, was the basis for this model.
Once the SDB was produced, TCarta included it as one of the many datasets used for interpolation of the remaining uncharted areas, creating the weighted in situ grid using the open-source Generic Mapping Tools (GMT). Individual data types were assigned weights based on source sensor/provenance and date of collection. All the data was then combined to a singular in situ grid at the DEM resolution, where coincident points from multiple sources were averaged based on their assigned weights.
In lieu of using NOAA’s Continuously Updated Digital Elevation Model (CUDEM) software, TCarta elected to implement a custom python-driven pipeline for aggregating, weighting, and interfacing with the interpolation algorithm directly. While CUDEM invoked the same open-source interpolation software, the custom pipeline allowed for more finite control over data integration, coincident in situ weighting mechanisms, and interpolation parameters. To assess the vertical accuracy of the DEMs, a set of 3,000 randomly sampled points from each AOI’s non-SDB bathymetry sources were collected. The elevation of each point was compared to the coincident DEM elevation, deriving absolute error, and absolute percent error. From these point statistics, an overall assessment of vertical accuracy was established, with three key metrics: mean absolute error, root-mean square error, and mean absolute percent error.

The results of the pilot project provided crucial information on the seafloor morphology of the three AOIs, providing indispensable spatial data to rural communities and was a proof of concept for integrating several datasets into a seamless topobathy product in Alaska. TCarta produced SDB totals of 13.54km² in Kachemak, 162.26km² in Teller, and 1.84km² in Point Hope. The 2m seamless DEM’s covered a total area of 1012.74km², 1160.69km², and 2292.28km² for Kachemak, Teller, and Point Hope, respectively. The data is available now to the public on NOAAs Digital Coast Data Access Viewer. As we look to the future of bathymetric charting, it is integral that we leverage older data with new technology to create products such as the seamless DEM. This will ensure that we do not sacrifice the work of our predecessors to temporal resolution constraints, but instead, leverage their insights to create higher resolution solutions. TCarta looks forward to working with NOAA’s Office of Coastal Management to continue discovering the uncharted in Alaska and use what we learned in this pilot project to provide essential coastal data using satellite derived bathymetry to partners worldwide.
References:
Riley, J. L., Wood, D., & Greenaway, S. (2016). The ellipsoid-referenced zoned datum: A poor man’s VDATUM for NOAA Hydrography in Alaska… https://nauticalcharts.noaa.gov/learn/docs/ellipsoidally-referenced-surveys/riley-greenaway-wood-poor-mans-vdatum.pdf
NOAA Digital Coast Data Access Viewer:
https://coast.noaa.gov/dataviewer/#/lidar/search/
Direct Links to TCarta’s Data:
Point Hope:
https://coast.noaa.gov/dataviewer/#/lidar/search/-18649972.441117406,10462037.971209325,-18469988.712294783,10607981.740325386/details/10032
Kachemak Bay:
https://coast.noaa.gov/dataviewer/#/lidar/search/-16908558.589935552,8262154.8243729845,-16784017.179408647,8361828.709256855/details/10032Port Clarence/Teller:
https://coast.noaa.gov/dataviewer/#/lidar/search/-18620824.460551787,9609000.735546758,-18476511.351149373,9717643.234859653/details/10032

