• Skip to primary navigation
  • Skip to main content
TCarta Satellite-Based Hydrospatial Tech

TCarta Satellite-Based Hydrospatial Tech

We are your contact for Marine Remote Sensing and Hydrospatial data services.

  • Who We Are
    • About
    • Partnerships & Affiliations
  • What We Do
    • What is Hydrospatial?
    • What Do We Measure?
    • How to Work with TCarta
  • Products & Services
    • Products
      • Global Bathymetry GIS
      • Satellite-Derived Bathymetry
      • Seafloor Classification
      • Newsletter Archive
      • Marine Basemaps
    • Services
      • Blue Carbon Mapping
      • Synthetic Aperture Radar (SAR)
      • Satellite-Derived Water Quality
      • Trident Tools Satellite-Derived Bathymetry Software
    • Custom Solutions
  • Case Studies
    • Space-based Hydrospatial Solutions for Engineering Projects in the Littoral Zone
    • Technology Demonstration Project: Large-Scale Satellite Derived Bathymetry Mapping
    • Hydrographic Office Technology Integration
    • Updating Information on Nautical Charts in Baffin Island, Canada
  • News & Press
    • Newsroom
    • Blogs
  • Product Viewer
  • Contact
  • Show Search
Hide Search

water quality

Satellite Derived Water Quality Analysis

TCarta Marine · February 16, 2024 ·

By Graeme Timmeney

Water quality has a significant history of monitoring across various satellite systems. Since the advent of publicly available satellites with the launch of Landsat in 1972, researchers and scientists have developed various methods for the monitoring of water bodies across the globe. One such satellite, MODIS (Moderate Resolution Imaging Spectroradiometer), an instrument mounted on NASA’s Terra and AQUA Satellite has been utilized in numerous studies related to water quality since its launch in 1999. Researchers have employed MODIS data to offer daily monitoring of water quality parameters such as chlorophyll-a concentration, turbidity, and suspended sediment concentration. The information on water quality derived from these satellites have been used to monitor harmful algal blooms and other water quality incidents throughout the globe. This information offers a historical snapshot in time of water quality at a very low resolution across very large areas.

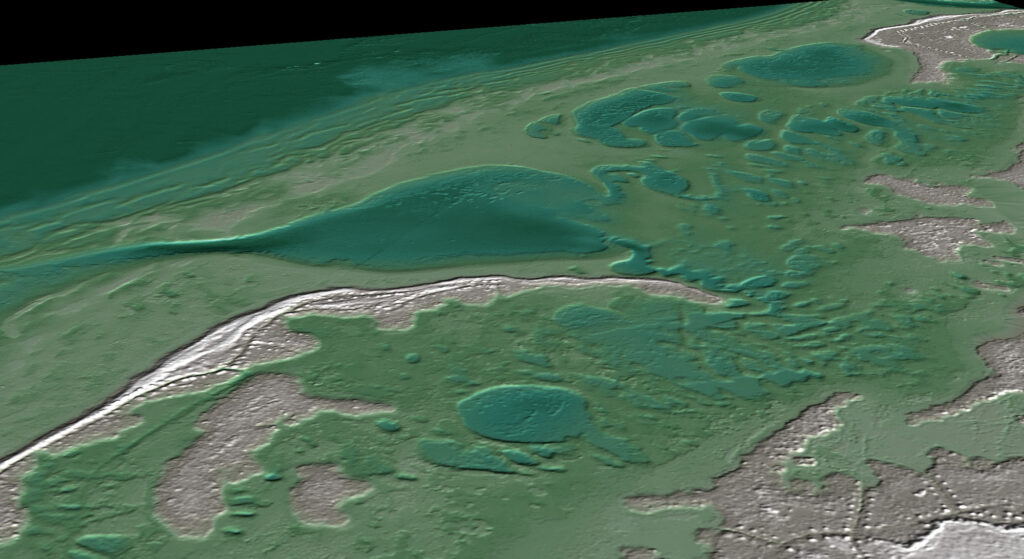
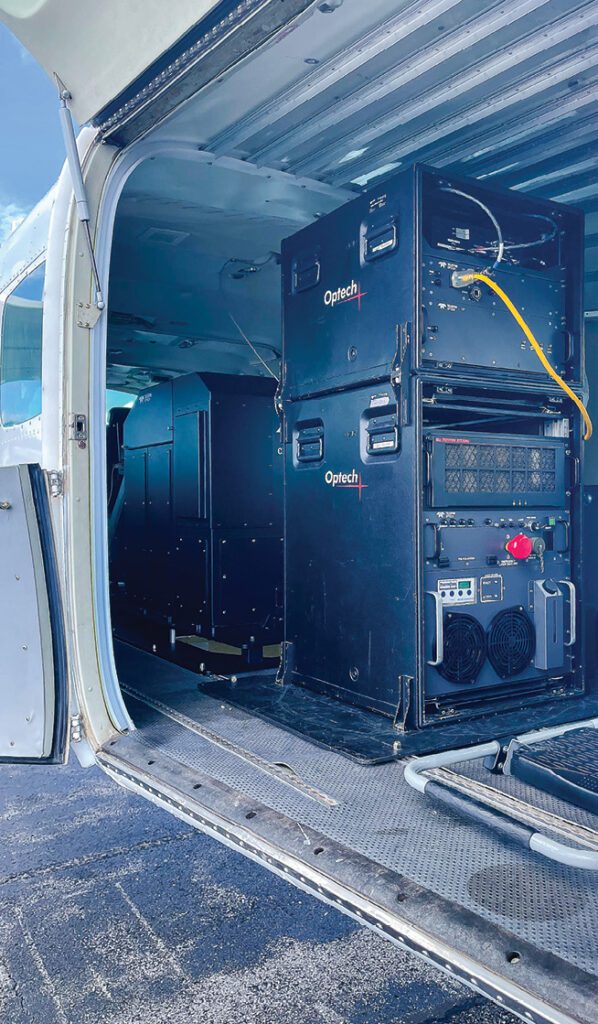
For many commercial and scientific applications, water quality must be monitored daily, with a short lag time of image acquisition to water quality metrics. One such application, airborne bathymetric lidar, can be heavily impacted by water column conditions such as turbidity and algal blooms. Bathymetric lidar surveys utilize airborne mounted sensors with a green laser at 532 nanometers that can penetrate the water column and return to the sensor, creating an accurate picture of the seabed up to 30 meters deep. Poor conditions can greatly impact the cost of mapping large areas. 

Historical water quality analysis utilizing free satellite imagery can offer a historical snapshot of water quality across large areas with high levels of accuracy, assisting companies with the process of planning for bathymetric lidar surveys. These historical analyses, undoubtedly useful for planning, can only offer previous trends from years past. With the advent of anthropogenic induced climate change across the ocean, seen clearly in the upward trend of sea surface temperature, these historical studies only reflect the past, not the present

TCarta has found and implemented a solution that takes both historical analyses, daily imaging and cloud computing to implement a fast and effective water quality monitoring solution that utilizes Planet Labs daily imaging to assist in bathymetric lidar surveys. Historical surveys at a large spatial scale across an AOI are conducted to identify areas with frequent water quality problems that could affect a bathymetric lidar survey. These large scale historical analyses offer a comprehensive analysis, allowing for the selection of individual sites within the survey area that are most useful for more frequent and current monitoring. With potential sites selected, daily imagery is captured and analyzed for a number of relevant metrics within a matter of hours and posted directly to a water quality dashboard that clients can utilize to assess trends and current conditions at a site on the same day as image capture. This information allows for strategic flight planning based on both the success of previous flights in relation to water quality metrics as well as the current state of water quality over a given study area. This method is agile and effective at reducing the number of flights and overall project cost.

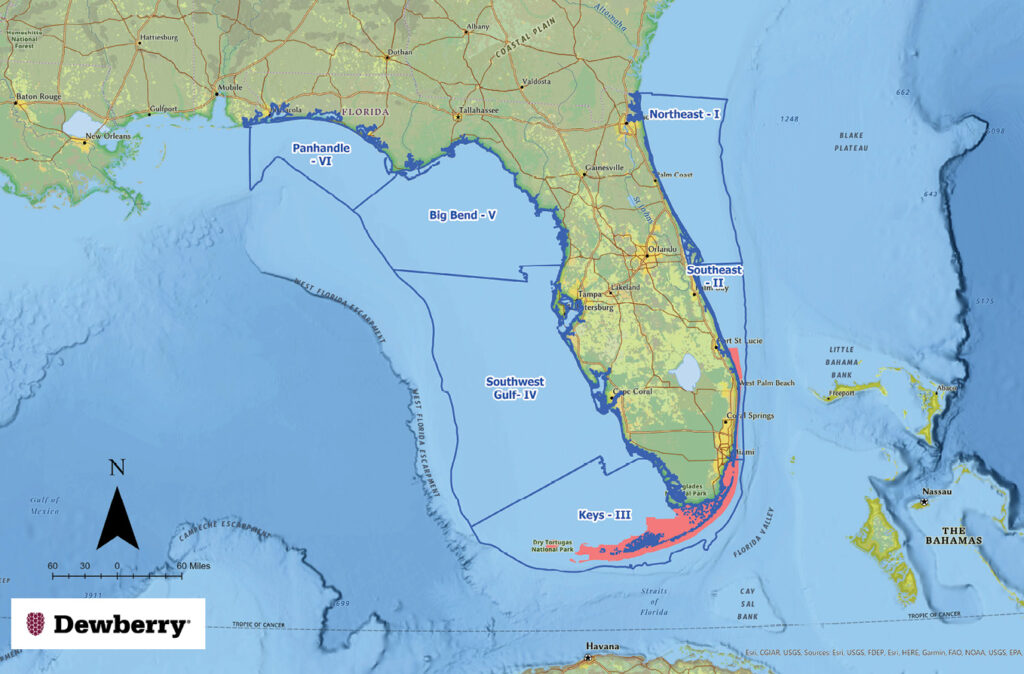
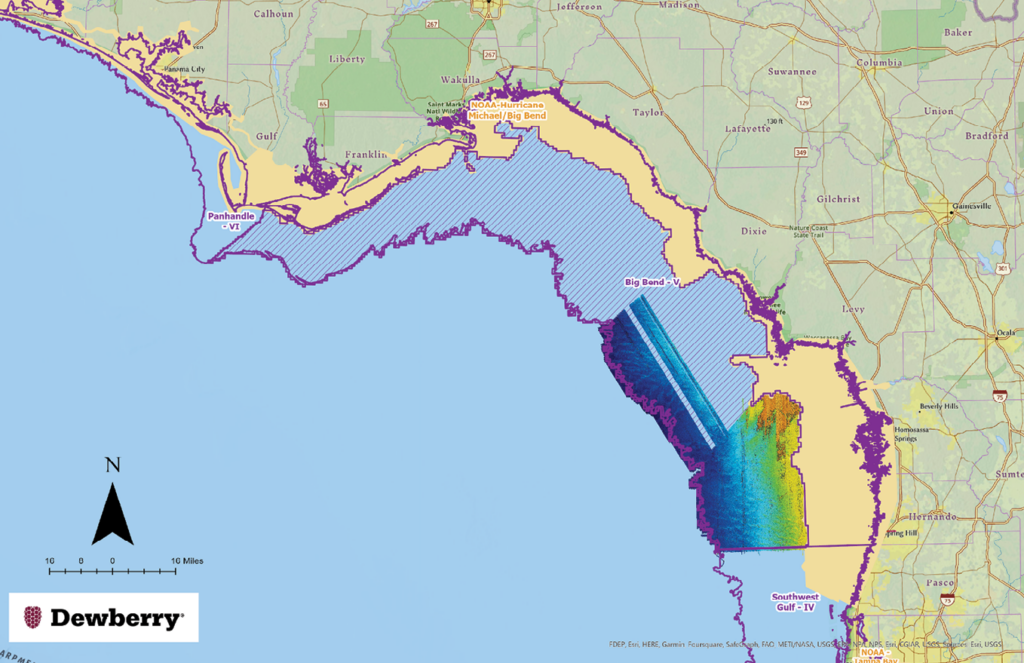
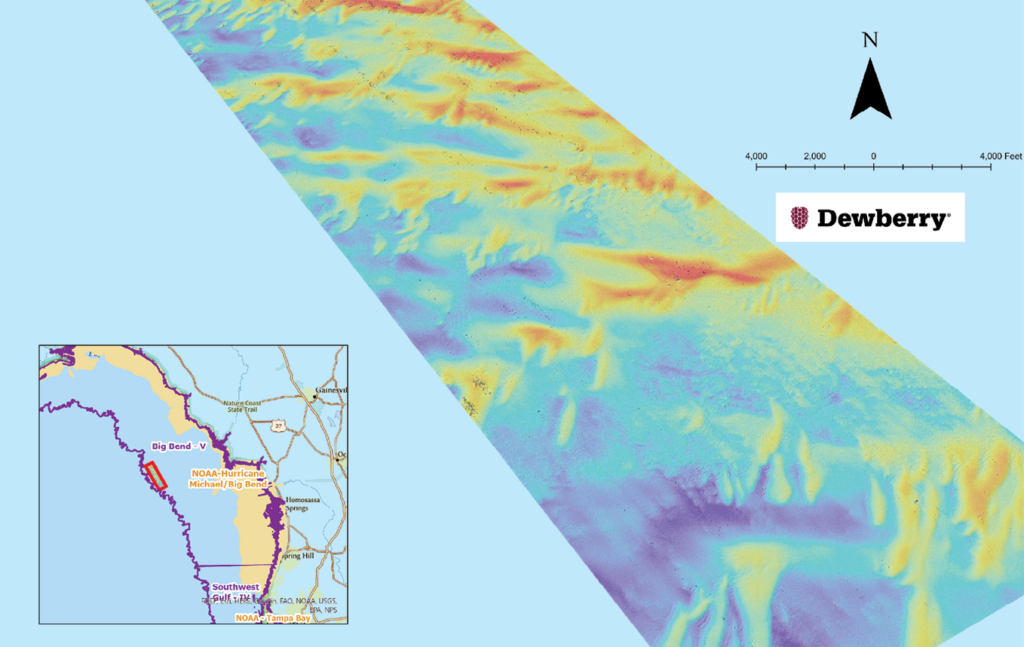
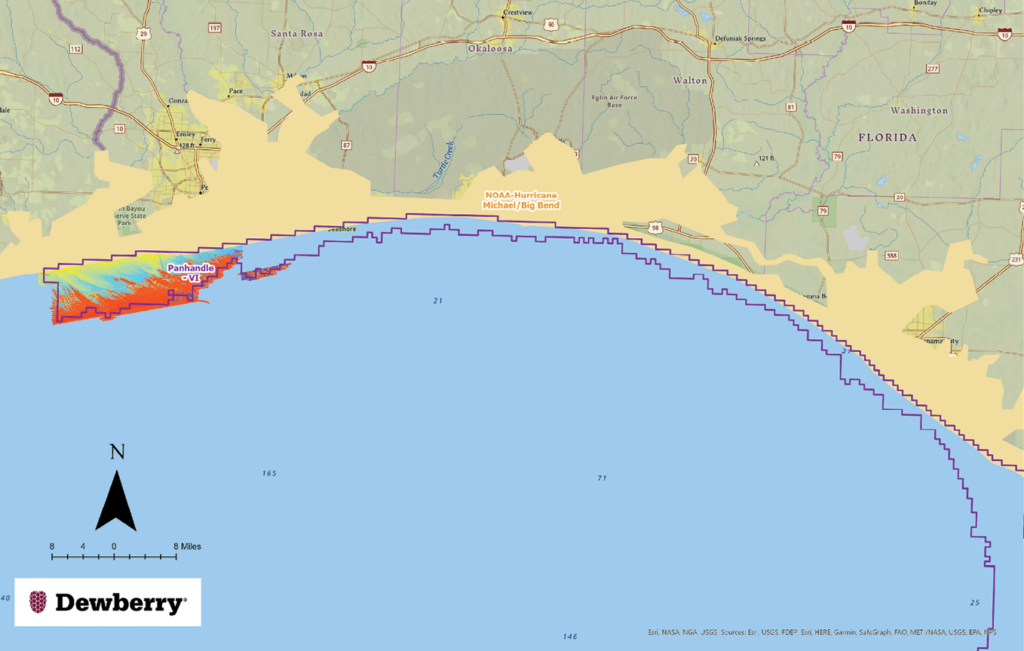
In a partnership with Dewberry, TCarta has implemented its daily water quality monitoring capabilities to assist in aerial bathymetric lidar planning across approximately 25,000 km2 of Florida’s coastline. A web-based dashboard was created to allow Dewberry to visualize water quality at 28 different sites for both historical and daily monitoring. This dashboard is updated within an hour of image capture with both the RGB imagery from Planet as well as 6 derived water quality metrics analyzing the potential for surface and sub-surface water quality conditions. Metrics analyze the potential for water column penetration as well as the presence of surface algae in the water. This dashboard has allowed Dewberry to increase the efficiency of flights across a massive area by informing the project managers of when and where is the best opportunity to fly on a given day. You can read more about Dewberry’s use of the dashboard here: Mapping Florida Waters

DEWBERRY ARTICLE

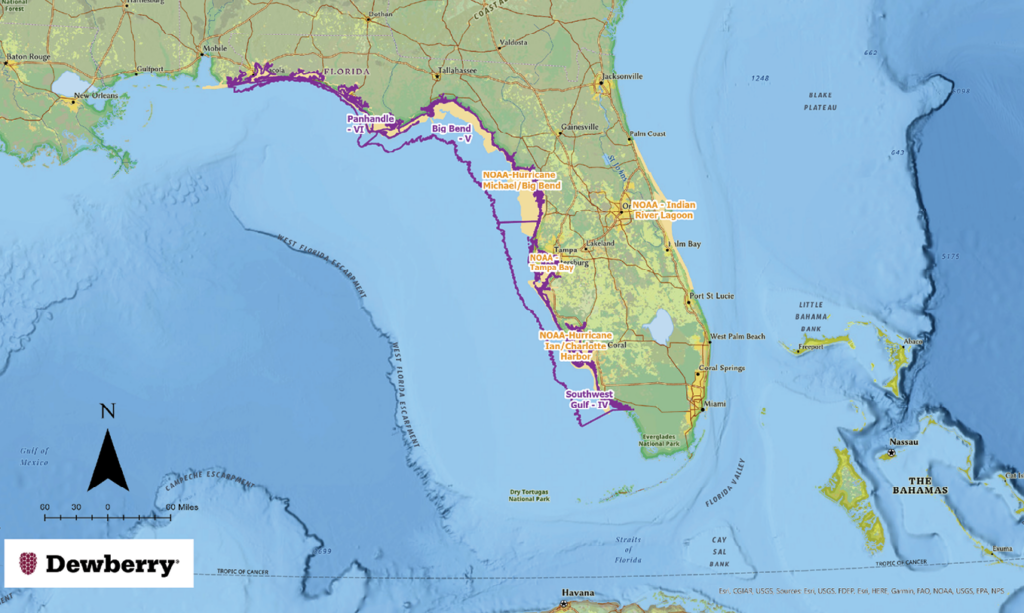
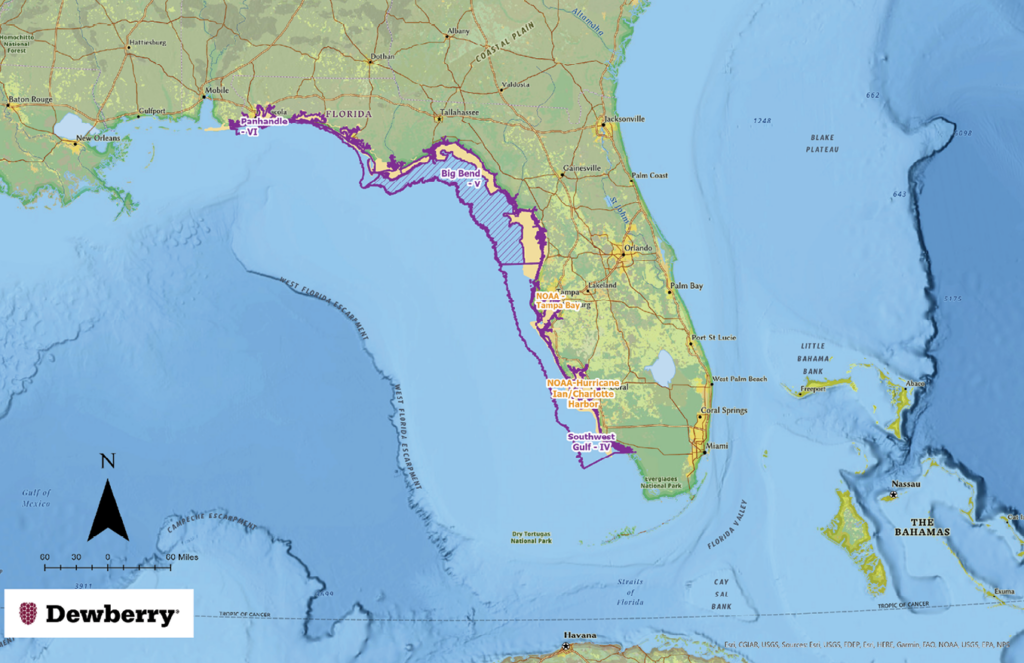
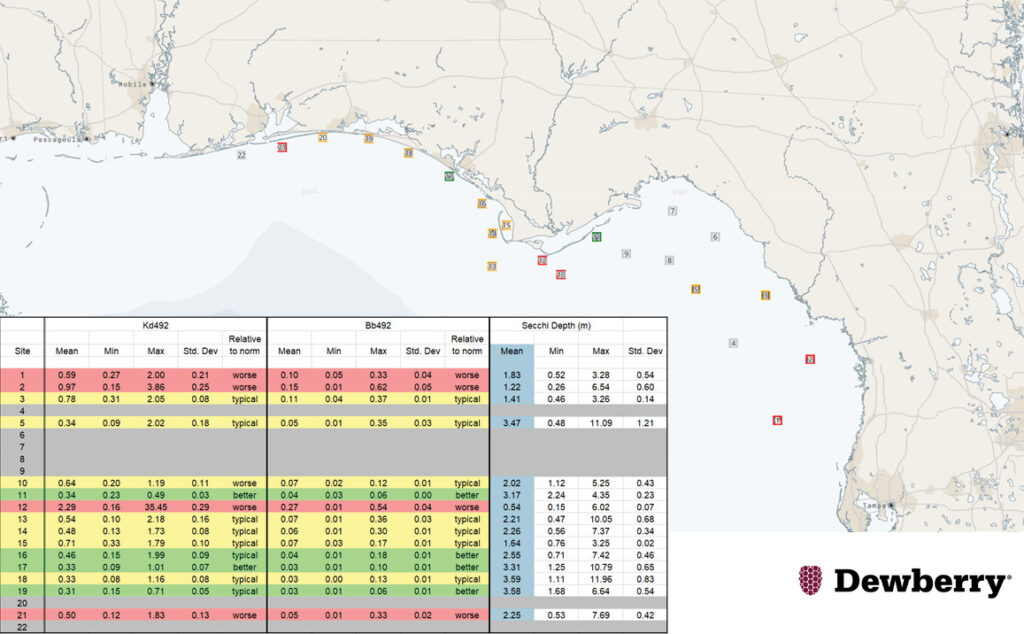
“Planning aerial acquisition missions, and particularly topo bathymetric missions in Florida, presents unique challenges. With the flat inland and coastal topography, even low-yield, inland rain events can result in large amounts of particulate runoff into the Gulf of Mexico. Combining the runoff with tannic components, such as those in the Suwannee River system in Big Bend, can result in poor water quality and unfavorable conditions for lidar bathymetry.

Figure 8: A daily water condition report for 16 October 2023 for 22 locations distributed in the Big Bend and Panhandle Regions, showing three (Kd492, Bb592, and Secchi Depth) metrics. Gray sample locations were clouded over on the date indicated and no data was generated; pink were below normal expected values; yellow, within normal expected values; green, better than normal expected values.

To help avoid collecting lidar during sub-optimum water clarity conditions, Dewberry has partnered with TCarta to provide satellite-derived bathymetry (SDB) for 22 selected sites dispersed throughout the regions. TCarta delivers the water clarity estimates daily based on several metrics, including the diffusion coefficient (Kd492), the backscatter coefficient (Bb492), and secchi disk depth (Figure 8) to help evaluate the water clarity and interpret current water conditions relative to historic norms. This methodology has helped Dewberry minimize non-productive flights, therefore increasing efficiency and decreasing environmental carbon dioxide loading.”

Back to blogs

Mapping Florida Waters

TCarta Marine · December 31, 2023 ·

Dewberry works with Florida Department of Environmental Protection to map the Gulf Coast of Florida sea floor.

Read in LIDAR Magazine

Coastal Zone Mapping and Imaging Lidar (CZMIL) SuperNova nearshore topobathymetric lidar along the Gulf Coast of Florida.

Florida boasts the longest coastline of any state in the contiguous U.S., with over 8400 linear miles (NOAA method)1. Florida also has the largest submerged shallow shelf on the Gulf of Mexico/Atlantic Ocean and the only coral reef system (Figure 1) in the contiguous U.S. (Florida Department of Environmental Protection’s Office of Resilience and Coastal Protection).

Figure 1: The six regions identified by FCMaP and subsequently adopted by FSMI. Coral reef area shown in pink.

As about two-thirds of Florida forms a peninsula between the Gulf of Mexico and the Atlantic Ocean, the state is especially prone to tropical storms and cyclones/hurricanes. Since 1851, 121 named and unnamed hurricanes have hit Florida, more than any other state2, and since 2017, four storms have made landfall along the Gulf Coast, including hurricanes Irma (2017), Michael (2018), Ian (2022), and Idalia (2023). Hurricane Ian was the third most costly hurricane to hit the U.S., on record with a price tag of more than $113 billion. Losses resulting from Hurricane Idalia, still being tallied, are also considerable. With increasing ocean temperatures fueling tropical storms, we can expect hurricane intensity and frequency to increase into the future.

In response to the compounding effects of sea-level rise, coastal subsidence, and growing population pressure on the coastline, Florida has been placing increased importance on coastal resilience and sustainability. In 2019, the Florida Department of Environmental Protection (FDEP) created the Office of Resilience and Coastal Protection (ORCP)3 to guide its efforts. FDEP/ORCP has a multi-faceted approach to resilience, including coral reef protection, preservation of coastal and aquatic management areas, beach and inlet management, and the implementation of ecosystem restoration projects to prepare Florida’s coastal communities and state-managed lands for the effects of sea level rise, coastal flooding, erosion, and storms.

In 2022, the Florida Legislature allocated $100 million in general revenue funds to FDEP/ORCP for the Florida Seafloor Mapping Initiative (FSMI), to capture statewide topobathymetric lidar to the 20-meter isobath and acoustic/sonar soundings from the 20-meter isobath to the 200-meter isobath. FDEP/ORCP and the Florida Geographic Information Office (FGIO) constructed timelines and published anticipated schedules on respective program webpages. FGIO produced a dashboard4 to share the collection regions, progress updates, and data processing status.

Figure 2: Dewberry/NOAA topobathymetric and shoreline mapping projects in Florida along the Gulf Coast: the panhandle of Florida through the Anclote River (Hurricane Michael/Big Bend); Tampa Bay; the Manatee River outlet through Naples (Hurricane Ian/Charlotte Harbor); and, along the Atlantic Coast, the Indian River Lagoon. Areas in purple are FSMI regions assigned to Dewberry for CZMIL SuperNova mapping.

For many of the reasons indicated above, the Office of Coastal Management (OCM) of the National Oceanic and Atmospheric Administration’s (NOAA) has been updating navigation charts and coastal surveys along Florida’s coastline. Since 2018, Dewberry has been updating large segments of the coastline and mapping the bathymetry using topobathymetric lidar (Figure 2). Some of these efforts preceded FSMI; while some areas of interest coincide with FSMI, and some are being collected simultaneously with and complement the FSMI project. This article discusses the first phase of FSMI, specifically updates to the bathymetry and shoreline mapping along the Gulf Coast of Florida.

The FSMI project area

In 2017, the Florida Coastal Mapping Program (FCMaP)5 designated six regions of Florida as the basis for studying the quality of available bathymetric data. FDEP/ORCP adopted those six regions (Figure 1) as the basis for awarding contracts to topobathymetric lidar and multi-beam sonar providers. Each region was identified with a name and a region number, starting in northeastern Florida and proceeding clockwise through the Florida panhandle:

  • Northeast-Region I
  • Southeast-Region II
  • Keys-Region III
  • Southwest Gulf-Region IV
  • Big Bend-Region V
  • Panhandle-Region VI

The project is separated into two phases. Phase one focuses on using topobathymetric lidar to collect bathymetry to the 20-meter isobath. This topobathymetric lidar phase spans approximately 58,000 km2 as illustrated in Figure 2. Phase two will focus on collecting acoustic, multi-beam sonar data for water depths between 20 meters and 200 meters.

Dewberry’s role

Dewberry was awarded approximately 25,000 km2 of the project for topobathymetric lidar mapping, including the entire Gulf Coast of Florida, from Pensacola in the western panhandle south through Naples (Figure 3). This includes Southwest Gulf–Region IV, Big Bend–Region V, and Panhandle–Region VI. Dewberry is deploying three CZMIL SuperNova topobathymetric lidar sensors for data collection, which were chosen based on their ability to measure up to 3.5 secchi disk depth through the water and to the 20-meter isobath. The sensors are mounted in Cessna Caravan airframes operating from bases throughout the project area (Figure 4).

Figure 3: FSMI regions for topobathymetric lidar mapping; water depths to the 20-meter isobath in purple. Dewberry was tasked by NOAA to collect near-shore lidar bathymetry in the Big Bend-Region V area (see tan areas in Figure 2) for the NOAA/Hurricane Michael Relief Program. The FSMI area of interest was refined to include only the hatched area.
Figure 4: Dewberry’s CZMIL SuperNova sensor mounted in a Cessna Caravan. This sensor is housed at the Peter O. Knight Airport in Tampa, Florida.

Current progress

Dewberry started collecting lidar bathymetry in Big Bend–Region V in July 2023 and continued through the end of August 2023, when Hurricane Idalia made landfall in the Big Bend region near Steinhatchee. By late August, Dewberry had collected approximately 31% (~3500 km2) of the area of interest in Big Bend-Region V (Figure 5), and almost 20% (~600 km2) in Panhandle-Region VI (Figure 6).

Figure 5: Quicklook showing CZMIL SuperNova topobathymetric lidar coverage collected prior to Hurricane Idalia, August 2023, in the Big Bend-Region V of the FSMI. Data coverage extends to the 20-meter isobath on the west, and approximately 30% of the Region V area. The tan area was collected for the NOAA/Hurricane Michael Relief Program.
Figure 6: Detailed digital elevation model derived from CZMIL SuperNova returns near the 20-meter isobath in the Big Bend-Region V.

Preliminary results

Dewberry is currently processing and calibrating the initial CZMIL SuperNova data from August 2023 using the Teledyne CARIS software. Dewberry has also developed a custom process to create “Quicklook” products that allows visualization of the topobathymetric lidar without expending considerable processing time and expense. Figure 5 shows the extent of the CZMIL SuperNova data collected prior to Hurricane Idalia for the southern portion of Big Bend-Region V. The preliminary results of the topobathymetric data reveal features and bathymetry extending out to the 20-meter isobath and completely within the near-shore area of interest (Figures 5 and 7).

Figure 7: Quicklook showing CZMIL SuperNova topobathymetric lidar coverage collected prior to Hurricane Idalia, August 2023, in the Panhandle-Region VI. Data coverage extends to the 20-meter isobath on the south, and approximately 18% of the Region VI area. The tan area was collected for the NOAA/Hurricane Michael Relief Program.

Further investigation of the Quicklook data in the Big Bend area revealed that the CZMIL SuperNova sensor was recording highly detailed bathymetric returns near the 20-meter isobath (Figure 6), which led the FDEP/ORCP to modify the task orders to include lidar bathymetry past the 20- meter isobath.

Innovative planning methodology

Planning aerial acquisition missions, and particularly topobathymetric missions in Florida, presents unique challenges. With the flat inland and coastal topography, even low-yield, inland rain events can result in large amounts of particulate runoff into the Gulf of Mexico. Combining the runoff with tannic components, such as those in the Suwannee River system in Big Bend, can result in poor water quality and unfavorable conditions for lidar bathymetry.

Figure 8: A daily water condition report for 16 October 2023 for 22 locations distributed in the Big Bend and Panhandle Regions, showing three (Kd492, Bb592, and Secchi Depth) metrics. Gray sample locations were clouded over on the date indicated and no data was generated; pink were below normal expected values; yellow, within normal expected values; green, better than normal expected values.

To help avoid collecting lidar during sub-optimum water clarity conditions, Dewberry has partnered with TCarta to provide satellite-derived bathymetry (SDB) for 22 selected sites dispersed throughout the regions. TCarta delivers the water clarity estimates daily based on several metrics, including the diffusion coefficient (Kd492), the backscatter coefficient (Bb492), and secchi disk depth (Figure 8) to help evaluate the water clarity and interpret current water conditions relative to historic norms. This methodology has helped Dewberry minimize non-productive flights, therefore increasing efficiency and decreasing environmental carbon dioxide loading.

Reference

Florida Department of Environmental Protection, 2023. Florida’s Coral Reefs, https://floridadep.gov/rcp/rcp/content/floridas-coral-reefs (accessed 20 October 2023).


1 coast.noaa.gov/czm/mystate/

2 cnn.com/2017/09/11/us/hurricanes-landfall-by-state-trnd/index.html

3 floridadep.gov/orcp

4 floridagio.gov/pages/FSMI

5 fcmap-myfwc.hub.arcgis.com

6 Maune, D.F. and A. Nayegandhi (eds.), 2018. Digital Elevation Model Technologies and Applications: The DEM Users Manual, 3rd Edition, ASPRS, Bethesda, Maryland, 652 pp.

back to newsroom

Subscribe to our newsletter


Loading

TCarta Marine LLC

1015 Federal Boulevard
Denver, CO 80204, USA

+1 (303) 284-6144

TCarta Caribe LLC

26 Haining Road
New Kingston, Jamaica

+1 (876) 817-8567

TCarta Canada Services Ltd.

1771 Robson Street - 1508
Vancouver, BC, V6G 3B7 CA

  • What We Do
  • Legal
  • Contact
  • LinkedIn
  • Instagram
  • Facebook
  • Twitter