Explore our latest news, blogs, and resources.
Join our global community as we share insights, project milestones, and how TCarta is contributing to the future of marine intelligence.
Featured
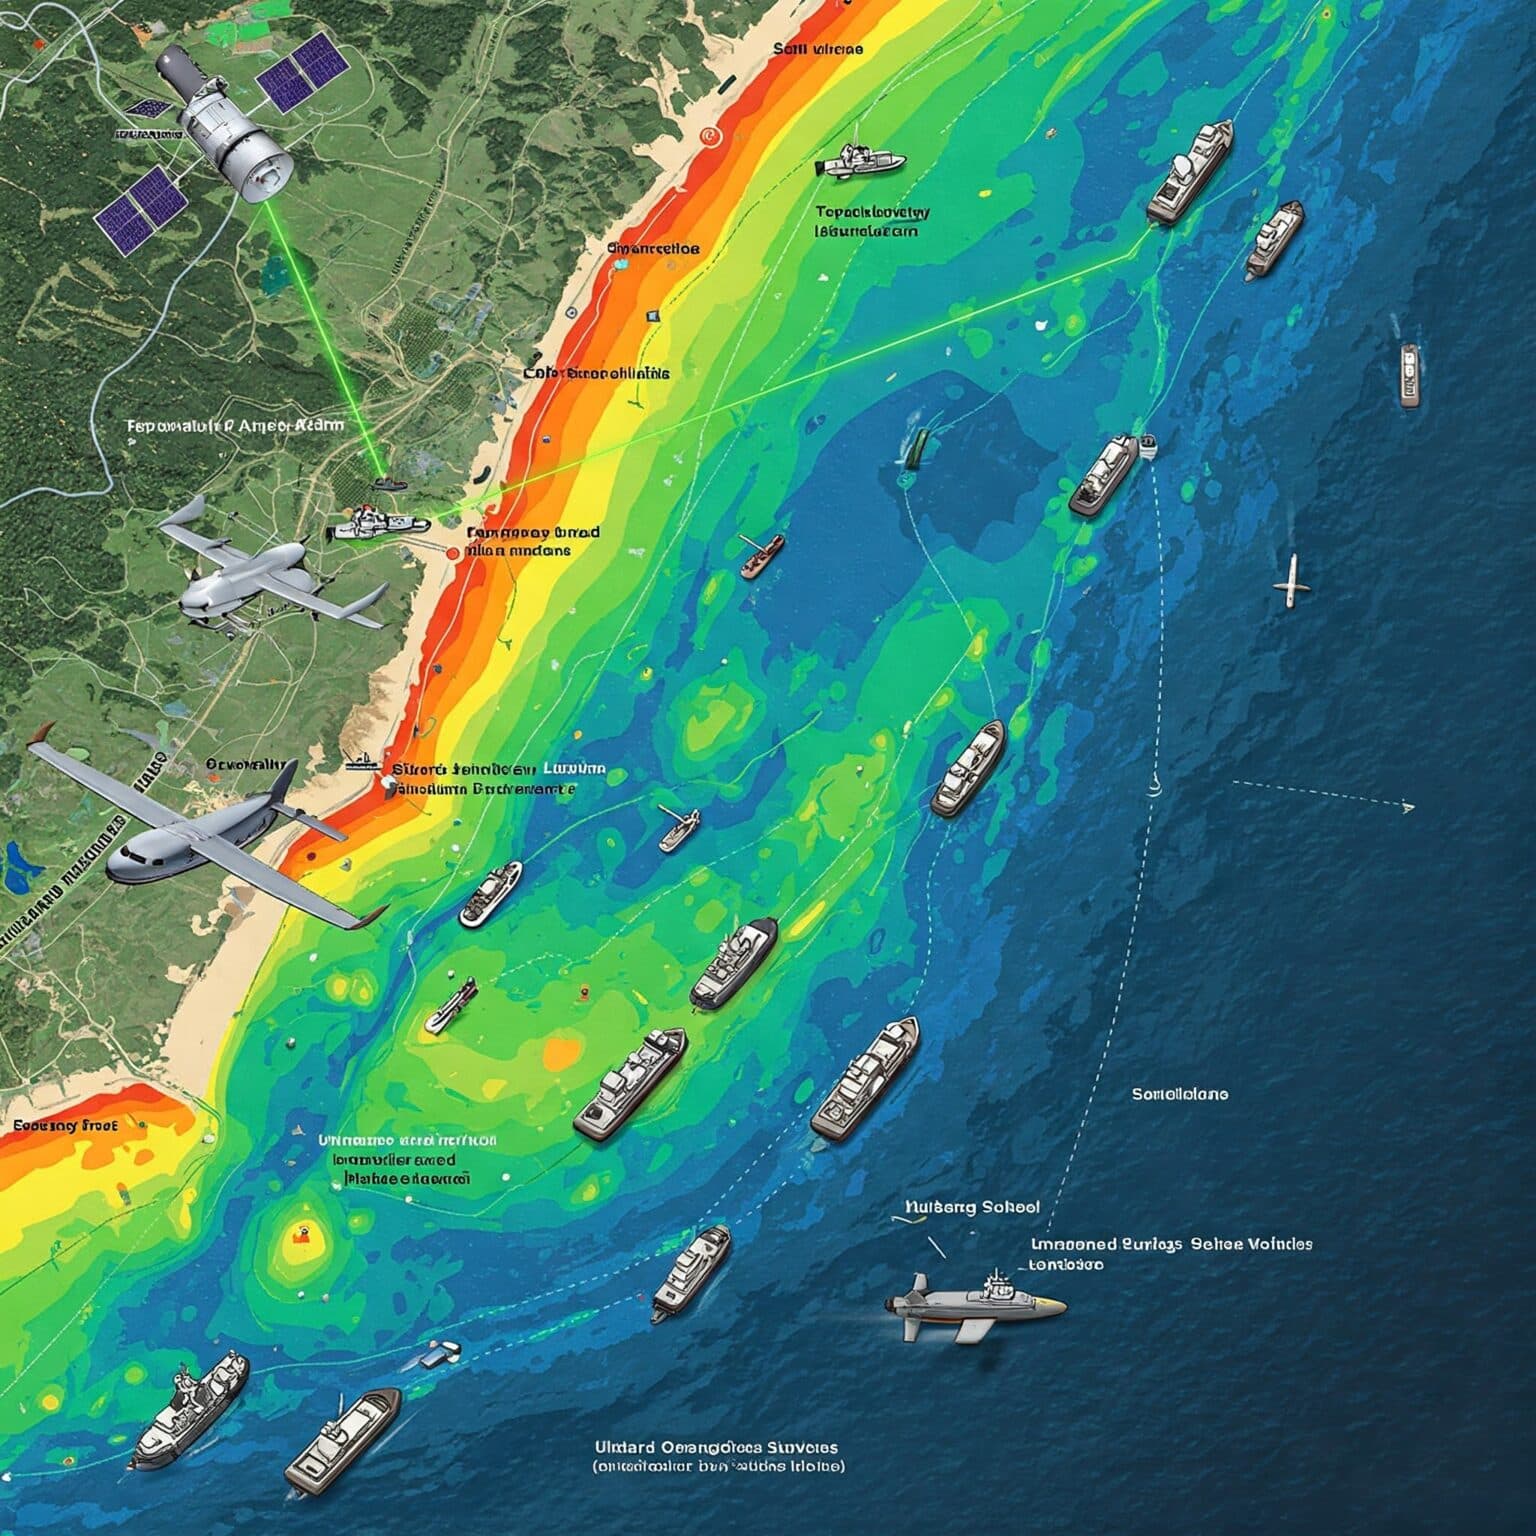
Beyond Either/Or: Integrating Hydrographic Technologies for a Data-Driven Future
For too long, discussions about hydrographic surveying methods have centered on comparing and contrasting individual technologies – multibeam vs.
Read MoreCategories


.png&w=3840&q=75)